Stop Finding Out Your Site Is Down From Your Customers.
Monitor your Linux and Windows servers, websites, background cron jobs, and databases in one simple, powerful dashboard. Get instant alerts before downtime hurts your business.
No credit card · Live in 2 minutes · Install the agent from your setup wizard

Trusted by




Built for the way your team works
One single dashboard that gives you total visibility from server hardware up to the user-facing web experience.
For DevOps, SRE and sysadmins
Infrastructure monitoring for teams that need server metrics, uptime checks and alerts without running Prometheus, Grafana and Alertmanager themselves.
- ✓ Replace three self-managed tools with one monitoring platform.
- ✓ Keep server monitoring, uptime checks and cron job monitoring in one place.
- ✓ Start with the live demo or create a trial without a credit card.
What engineers and operators say
Real feedback from developers and sysadmins using our infrastructure suite.



Everything you need to monitor infrastructure
Server metrics, uptime checks, cron jobs, network devices and automation. All in one place.
01 / Server Monitoring
Server Monitoring
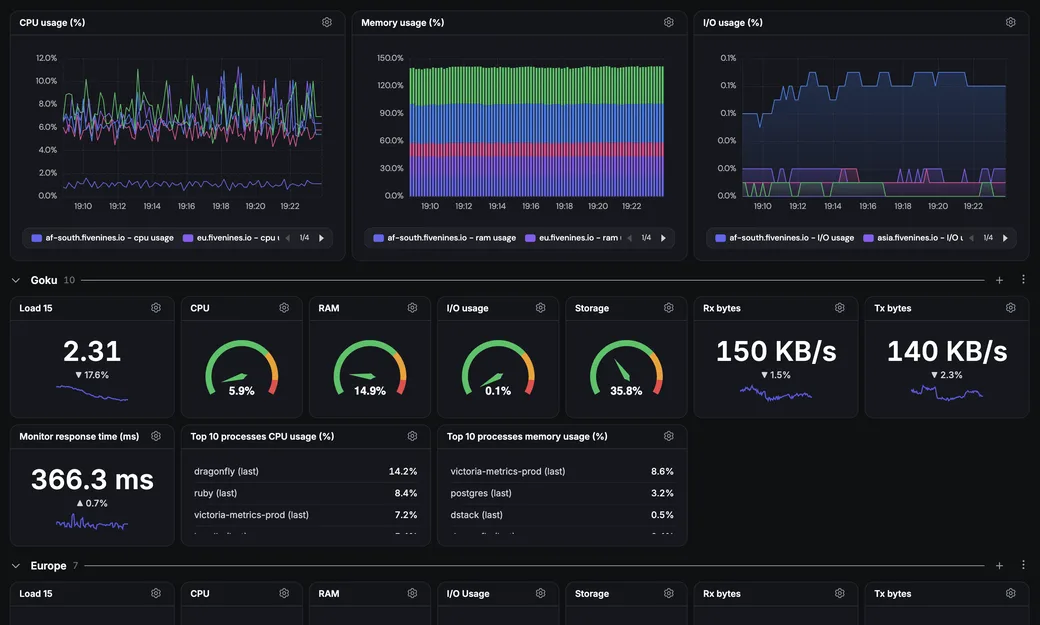
Server metrics via our open-source agent on Linux and Windows. Default collection is 60 seconds, with custom intervals down to 5 seconds when needed.

02 / Uptime & Status
Uptime & Status
HTTPS, TCP, ICMP and DNS checks from multiple regions, with confirmation before noisy alerts reach your team.

03 / Automation & Scheduling
Automation & Scheduling
Cron job monitoring plus workflow automation for routing, retries, delays and escalations.

04 / Network
Network
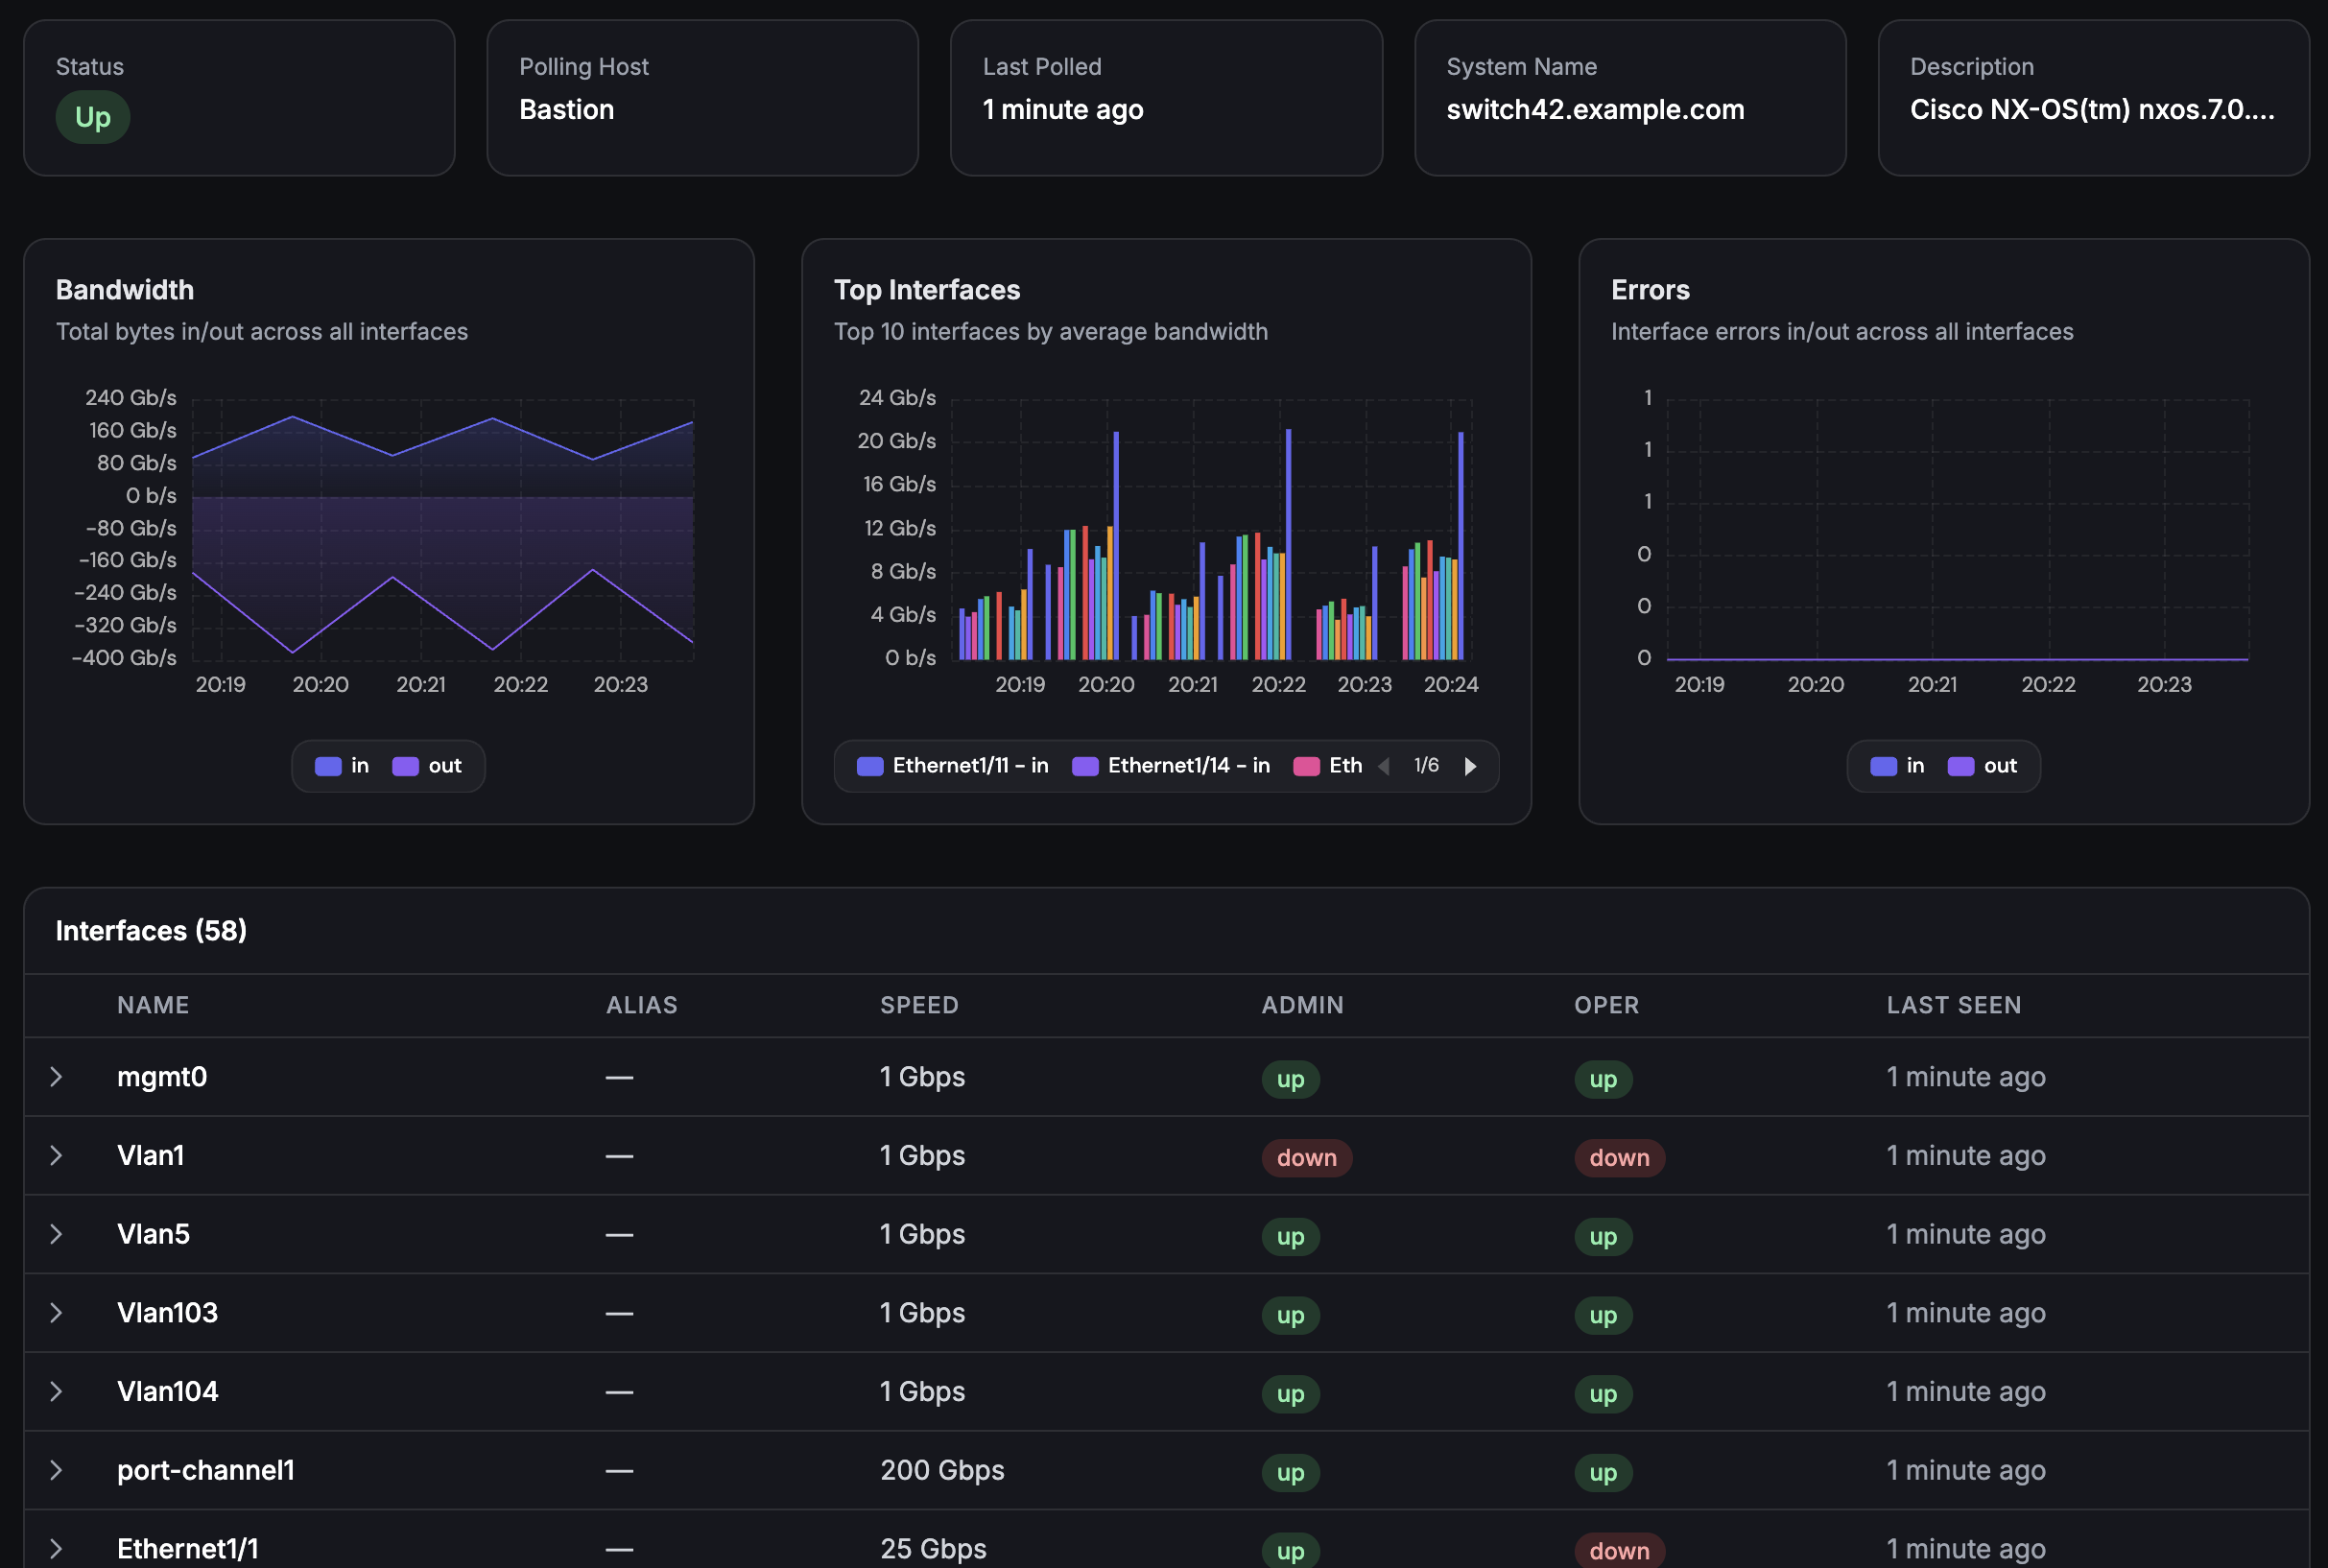
SNMP monitoring for switches, routers and firewalls. Add devices explicitly and keep network health next to server health.
05 / Developer Tools
Developer Tools
API-first infrastructure monitoring. Manage monitors as code and export data when your stack needs it.
GET /api/v1/monitors

{
    "status": "ok",
    "managed_by": "terraform",
    "alerts": ["slack", "webhook"]
}
Live in 3 steps. Under 10 minutes.
› �� trial created
› �� deploy agent on your instances
Create the account
The setup wizard generates the install instructions for your organization.
› workflow.trigger = cpu_high
› notify.slack('#ops')
Configure alerts and workflows
Set thresholds, build workflows, and route alerts to email, Slack, Teams, Telegram, Discord, Pushover, PagerDuty or webhooks.
› CPU 95% on web-01
› confirmed from 4 regions
Get alerted in seconds, not minutes
When something breaks, our platform confirms it, routes it and gives your team the context to act.
Know what you are installing before you install it.
Our agent is open source and uses an outbound HTTPS push model. It collects infrastructure telemetry; it does not give a remote command channel on your servers.
01
Open source
The agent source is public, so engineers can inspect what runs before rolling it out.
02
Outbound only
The agent pushes metrics over HTTPS. Your host does not need to expose an agent port to the internet.
03
No remote control path
The dashboard cannot SSH into your server or execute arbitrary commands through the agent.
04
Explicit permissions
Base metrics work with normal local reads. Optional modules stay off until you enable them explicitly.
Typical data sent
Compare
Fecleshost vs Datadog, Better Stack and UptimeRobot
Most teams shopping for infrastructure monitoring already use Prometheus, Datadog or UptimeRobot. Here is the practical difference: breadth, openness, setup time and price.
| Capability | Fecleshost | Datadog | Better Stack | UptimeRobot |
|---|---|---|---|---|
| Server metrics | Open-source agent | Agent-based | Limited | No |
| SNMP network monitoring | Included | Paid add-on | No | No |
| Uptime and SSL checks | Included | Add-on | Included | Included |
| Cron job monitoring | Included | Add-on | Included | Limited |
| Open-source agent | Yes | No | No | No |
| Terraform provider | Yes | Yes | Yes | No |
| Transparent pricing | From low cost | Per-host & per-feature | From $29/mo | Free / paid plans |
| Time to first server | About 2 minutes | 30+ minutes | 15+ minutes | Uptime only |
Frequently Asked Questions
Got questions about setup, pricing, or security? We have answers.
What is the setup time?
Is there a money-back guarantee?
How do I migrate my site?
Start monitoring in 2 minutes
Free for 14 days. No credit card. Cancel anytime. Or skip signup and explore the live demo with real data.
Or explore the platform →Made in Nigeria · Open-source agent · Trusted by engineers and MSPs
